EcoWest Visualization Framework
A data visualization driven storytelling framework for Standford's EcoWest center
EcoWest Visualizations is a data visualization story telling framework I designed and developed for Standford's Bill Lane Center for the American West in collaboration with renown journalist Geoff McGhee.
The framework facilitates creating narratives which weave together maps and data visualizations to tell a sharable and embeddable story.
EcoWest Visualizations
The EcoWest framework aimed to facilitate creating stories involving temporal, geographic data. While D3 makes it possible to create highly customized interactive narrative experiences, the skill and time required can be highly prohibitive. This framework aimed to alleviate the problem by providing ready to use components that could be quickly set up and configured for individual stories.
Early Visualization Framework Screenshot
Initial Process
All generalizations, abstractions, and frameworks lose fidelity in some area. It's a tradeoff between custom behavior (harder, but more power) and out-of-the-box functionality (easier, but more constrained). To understand what tradeoffs needed to be made, I first analyzed the type of stories it was designed to tell.
The typical story was a linear narrative with interactive components, such as explorable maps and data visualizations. By brining together linear and non-linear elements, the reader can reacher a deeper understanding of the story. This is a story telling approach often found in video games. A "string of pearls" method of story telling in which pools of interactivity are strung together along a backbone of linear narrative.
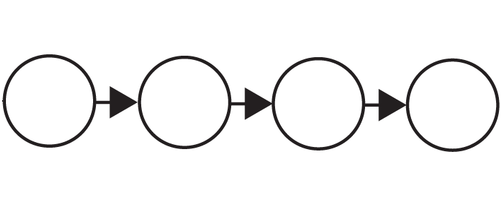
Each "pearl" of interaction is strung by linear narrative
The framework allows users to step between interactive layers - whether they be map components or visualization components. Information boxes are laid on top of the view to provide context and a narrative backbone. Some individual layers also have their inner exploration layers, such as a map layer showing wildfire spread over time, which fits into a larger narrative about wildfires. Switches in interactivity are all exposed through an event system that can be listened to or triggered for even more custom functionality.
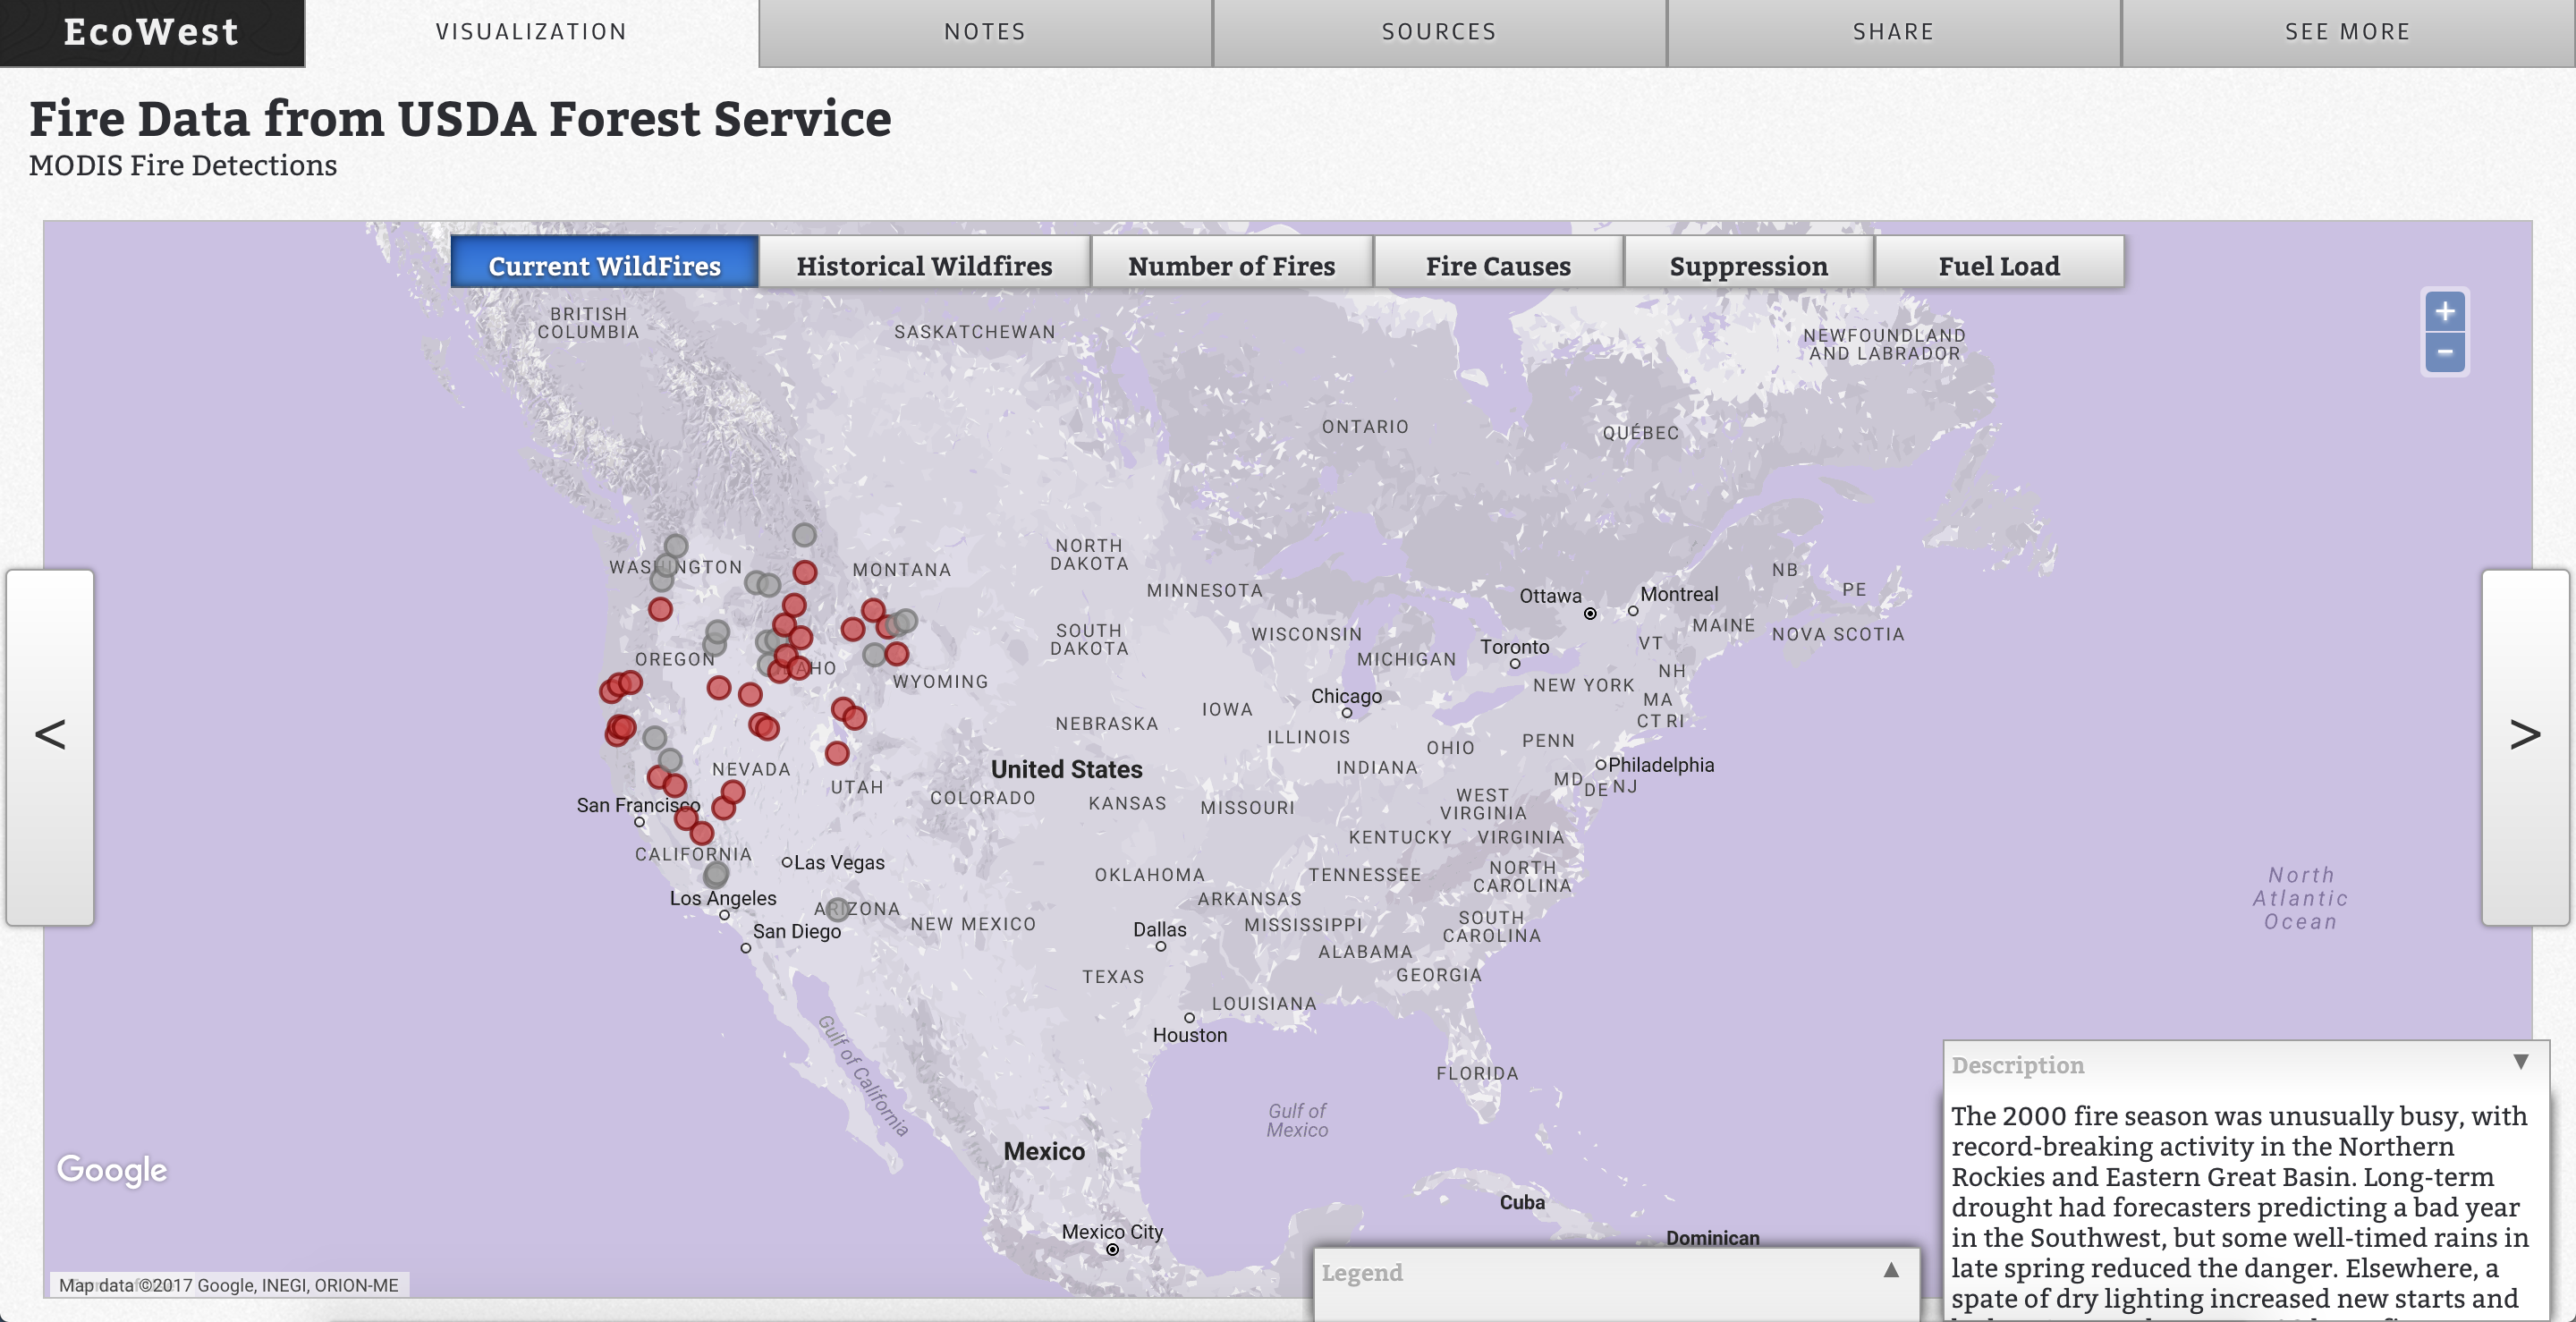
Early Prototype of Narrative Exploration
The above example is an early prototype of the example of interweaving narrative and exploration. Users can go forwards or backwards through the story's timeline to discover and better understand the data and underlying messages.
Sharing
Stories are meant to be told. After using the framework to create a story, it should be sharable. These stories are different in nature than typical linear text articles. Because these stories contain interactive elements and differ from traditional stories, it is important to share certain states of the story.
Two primary components of sharing exist:
- Sharing URLs
- Embedding the story into another page
Sharing the visualization itself through a URL is how users access it; while embedding the visualization enables content creators to share the story on their own site or include multiple stories together.
URL sharing was facilitated by an explicit share button, as well as the ability to copy the current URL at any time, which would be updated when view state changed.
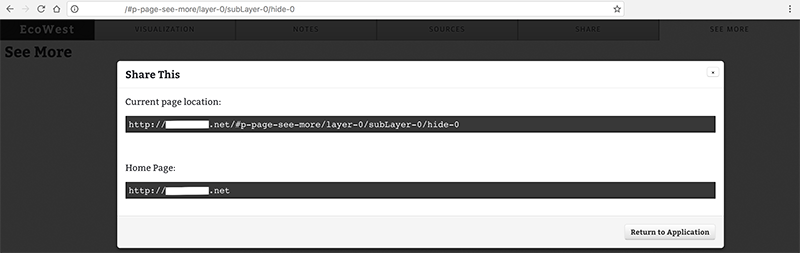
Early version of the share pop-up
As users changed the view, or a subsection of the view, the URL updates in response.
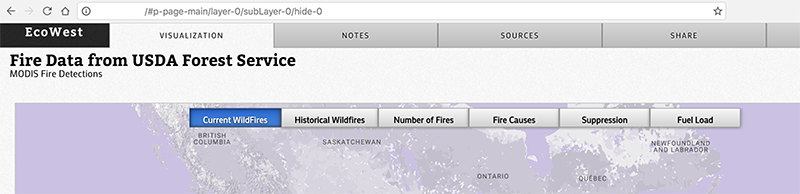
Initial URL state, containing the page information and current view data
When the user explores to a different part of the story, the temporal / time range layer switcher is updated and the URL is changed to reflect the current state.
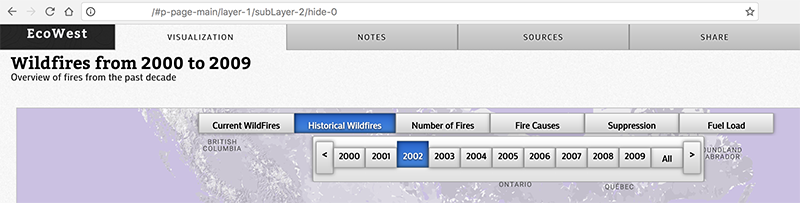
URL is updated when the story's state changes
IFrames
Another goal was to allow embedding of a story into a page with other stories. URL state was one component that made this process easier to control, but the framework's HTML and CSS structure has also to be responsive.
Embedded Story in an IFrame
Continued Usage
It is still being used as the basis for developing more interactive stories, with additional progress being made by the incredibly talented pair, David Kroodsma and Geoff McGhee.
Conclusion
By weaving data visualization into narrative, we can create compelling and information-rich stories. Users can gain a broader and deeper understanding of the story by exploring it, by playing with it, in ways they can't with traditional linear and text based stories. The framework succeed in accomplishing its goals and was used to create many rich, compelling stories. One was featured in National Geographic .
Wildfires since 2003
Even though I no longer am active in its development, the framework is still being improved upon and used to create even more stories.